Shmoo plots can be useful for graphically representing test results obtained when characterizing a part using two test variables.
When testing a device, one may want to know how a device will operate over a range of test parameters such as supply voltage and clock frequency. By varying the parameters while performing a functional test on the device, it is possible to characterize the device for a range of operating conditions. By plotting the test parameters and indicating a pass / fail condition in green or red for each test condition, the resulting two dimensional plot will graphically show the area over which the device operates or fails.
ATEasy v9 supports two dimensional Shmoo plotting using the AChart control within a Form. The Shmoo plot capability is used extensively with the TS-900 Semiconductor Test System for characterizing a device for a given range of operating conditions.
The following figure is an example of a Shmoo plot generated in ATEasy that represents the test results based on a sweep of the VCC and operating frequencies for a digital part:
In order to use the Shmoo Plot within a form, follow these steps:
1. Create a Form within ATEasy
2. Select the AChart control and draw the chart on to the Form
3. Right click on the newly placed AChart control, and select Properties.
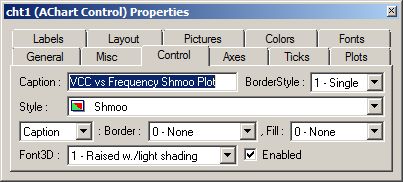
4. Select the "Control" tab and select "Shmoo" from the "Style" combo box.

The Shmoo plot is one of several styles that can be selected for an AChart Control.
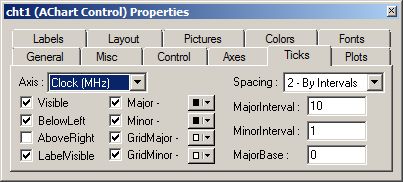
5. Select the "Ticks" tab and configure the Major and Minor intervals for the X and Y axis.

The minor interval sets the resolution of the axis.
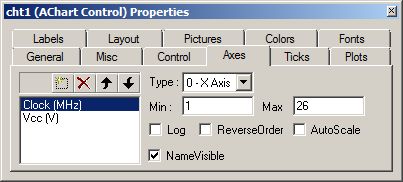
6. Select the "Axes" tab and configure the X and Y axis names and scales (min/max)

The "Axes" tab contains the minimum and maximum value for each of the axis. Each axis represents a variable that is being sweeped. The axis range (min/max) in conjunction with the Minor tick interval, determines the number of steps for a given axis. In this example, the X-axis (Frequency) has a range of 1-26 Mhz with a minor interval of 1 resulting in 26 steps for the sweep across the X-axis
7. Call the SetData member of the AChart control to set the measurement and Pass/Fail results for the Shmoo Plot.
Shmoo data is represented by an X axis value, a Y axis value, and the corresponding Test Result Boolean value. In this example, the X axis represents VCC and the Y axis represents the Frequency.
Each cell of data can be entered, one at a time, using the following call (the chart control is called "cht1" in this example):
cht1.SetData(0, dVcc, dFrequency,,,False, bTestResult)
bTestResult contains the Pass/Fail result of a functional test that was run with a particular value of VCC and VOH.
Note: This article uses a pre-release version of ATEasy 9.